Learning goals of this lab are as follows:
- Explore Image Histograms
- Operate the Inquire Cursor
- Interpret histogram data in images
- Utilize the “Help” menu effectively to locate ERDAS functions
- Identify features by interpreting digital data
Three maps were produced for the exercise - a good tip was to use the same map tempate and then swap out the .img file each time. I did finally seem to figure out a way to deal with the text boxes. I'm not particularly happy with the legends; I don't think they add much except the bands that I used.
Although the legend might be confusing on it, the one I'm particularly happy with is the image of the glaciers in Map 2. It's really interesting to me that thermal imaging would show a glacier so well.
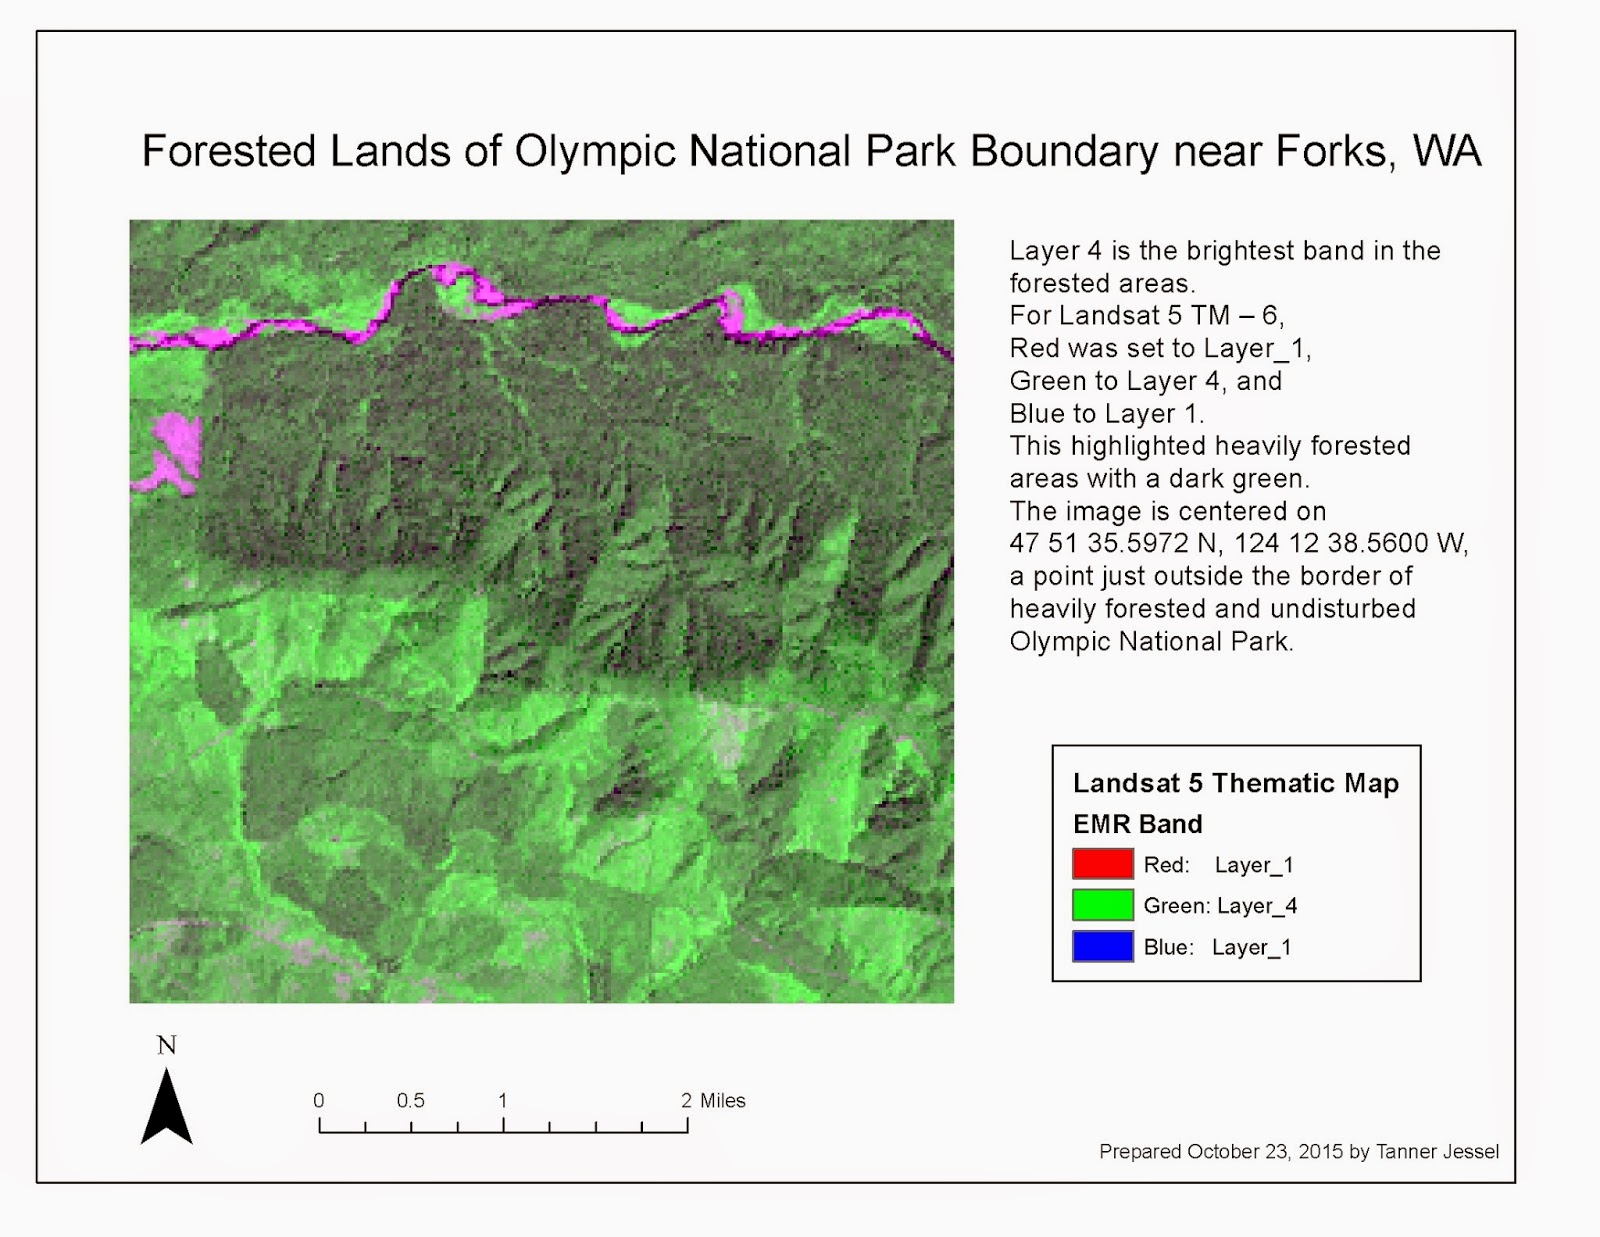 |
| Map 1: This shows a heavily forested, protected area adjacent to less heavily forested, unprotected lands. |
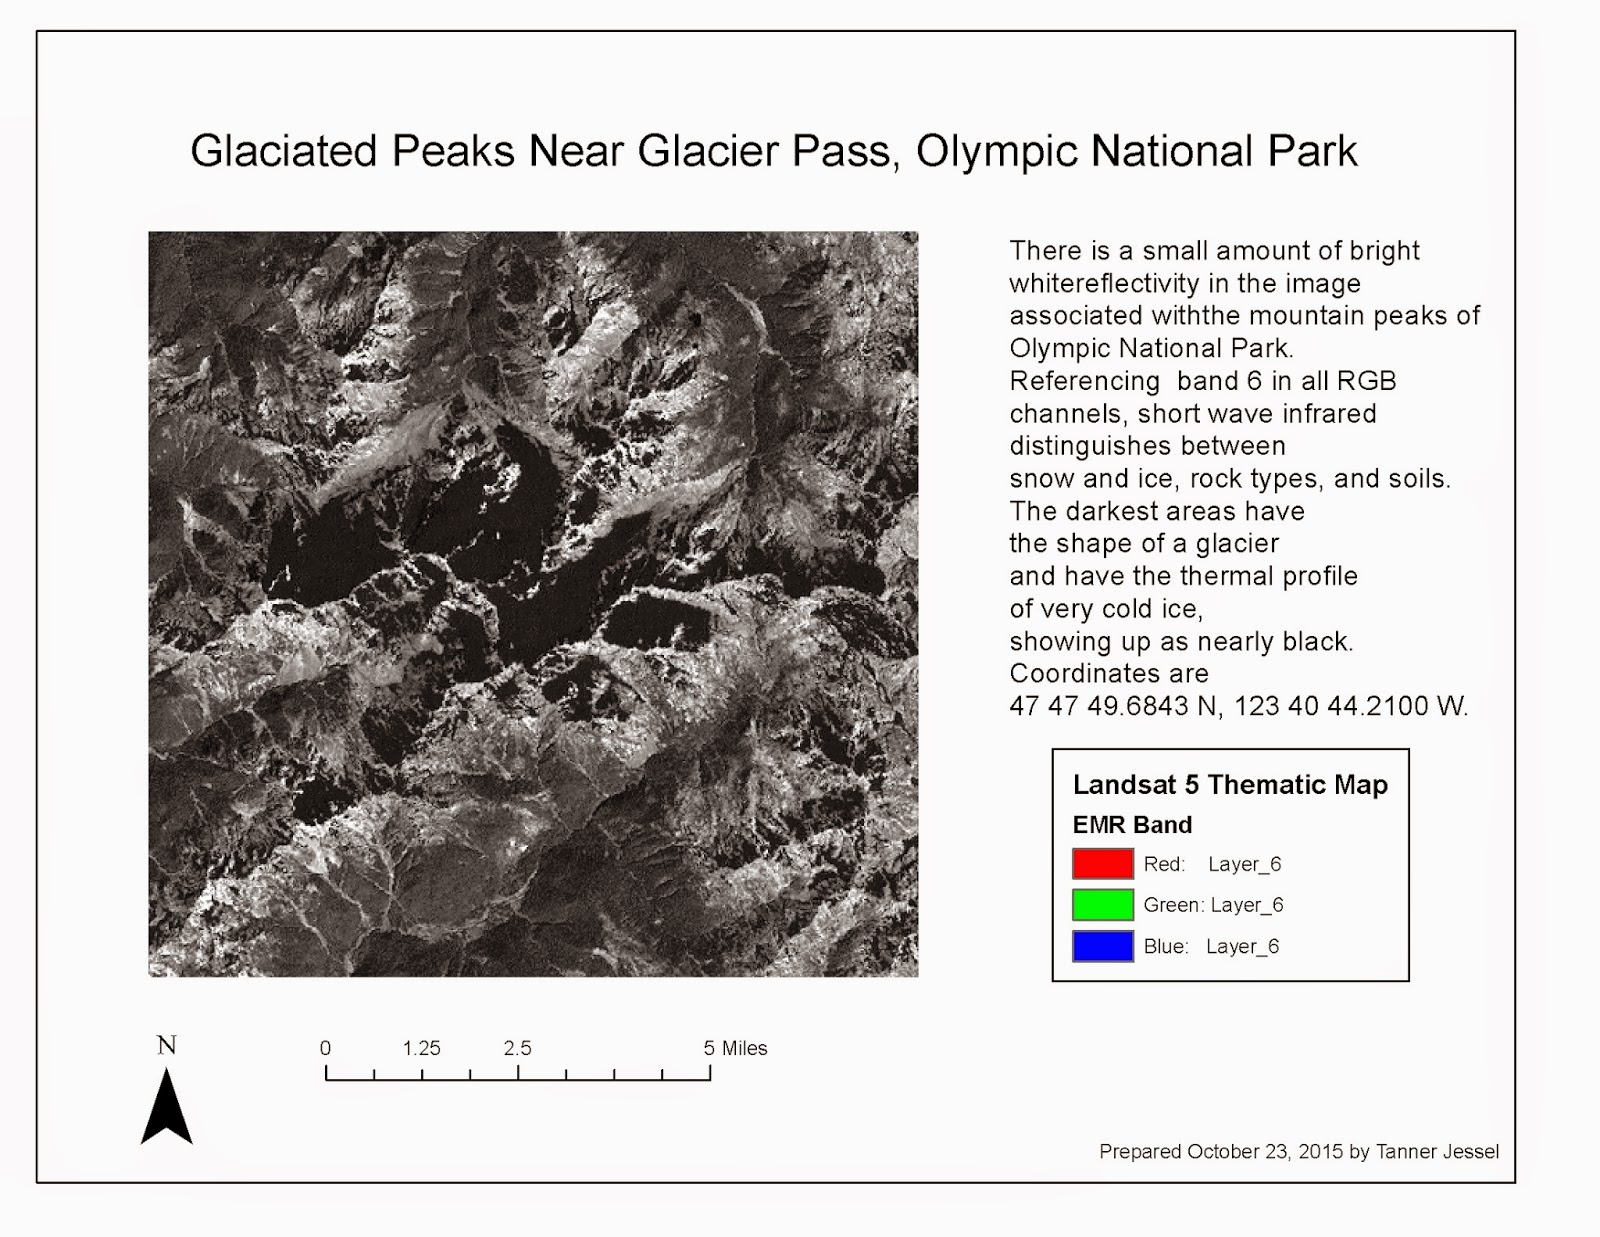 |
| Map 2: My intuition was these dark areas were glaciers - sure enough, Google Maps told me this was "Glacier Pass." |
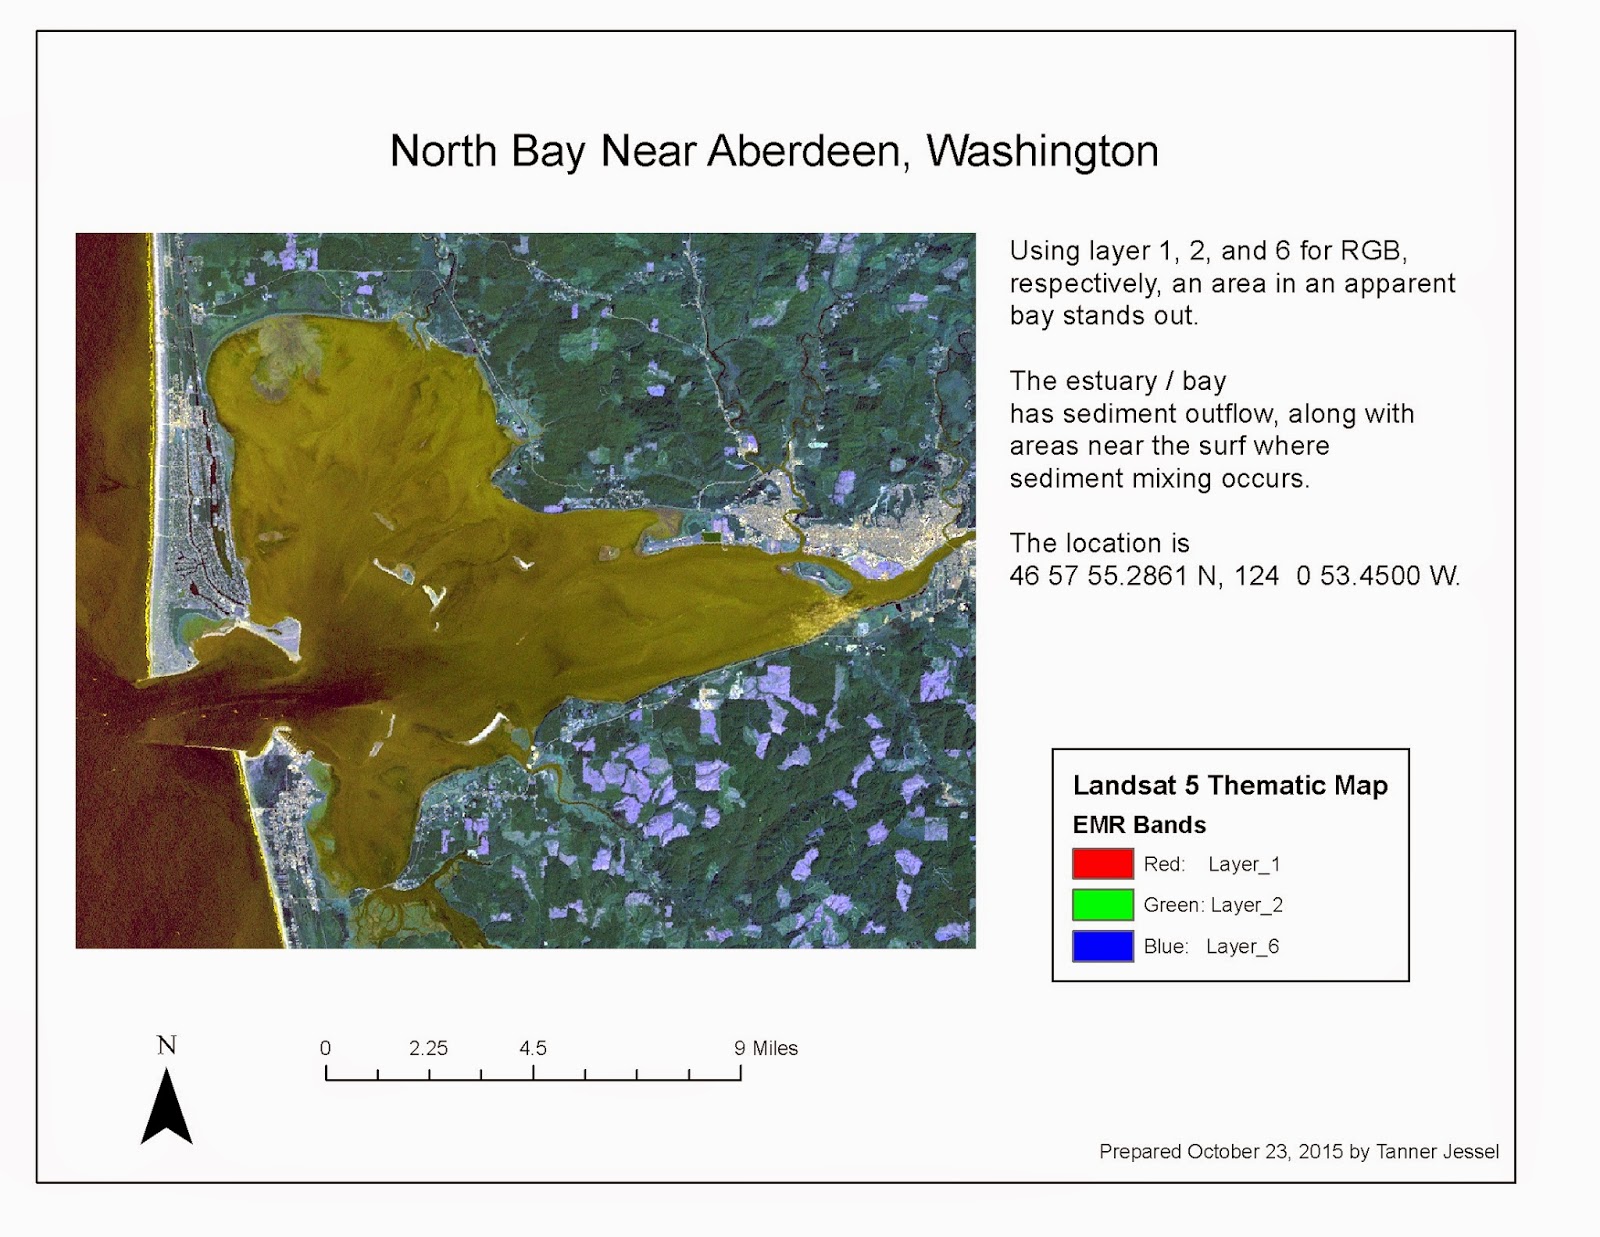 |
| Map 3: A bay on coastal Washington - I am unsure if the coloration is from phytoplankton or from sediment coloration. |
No comments:
Post a Comment